At last year’s iPhone event, Apple announced that, starting with iOS 12 and the new A12 Bionic processor, Core ML models could now take advantage of the Apple Neural Engine (ANE). The ANE is a special co-processor capable of accelerating machine learning models to run up to 9X faster using just a tenth of the energy. While we’ve been able to verify these speedups in certain cases, we noticed they weren’t universal. Some models didn’t seem to be benefitting from the new hardware.
After a lot of digging and experimentation, we discovered that not all Core ML layers and options are supported by the ANE. If your model isn’t compatible, it will fall back to running on the GPU (or CPU), which can be slower and less battery efficient for users. In this post, we’ll show you a how to determine which hardware your model is running on and what you can do to make your models compatible with the ANE to give your users the best experience.
Setup Xcode
Start by loading your project in Xcode and setting up the environment for testing.
- Make sure the project is configured to build and run your app on a physical device with an A12 (or newer) processor. Simulators won’t work, as the hardware isn’t virtualized. That leaves you with the following choices: an iPhone XR, XS, XS Max, or new iPad Pro.
- Set your build target to iOS 12 or later. Previous versions do not contain ANE APIs.
- Identify the place in your code where the model’s `.predict` function is called. This might be an explicit call or handled through the Vision Framework.
For the purposes of this tutorial, we’ll reference the simplified implementation below.
// PUT A BREAKPOINT HERE

// Compile the model.
let compiledModelURL = try! MLModel.compileModel(at: assetPath!)

// Initialize the model for use on a specific set of hardware
let config = MLModelConfiguration()
config.computeUnits = .all // can be .all, .cpuAndGPU, or .cpuOnly
let mlmodel = try! MLModel(contentsOf: compiledModelURL, configuration: config)

// Create a feature provider specific to your own model.
let inputFeatureProvider = // … You'll need to write some code here

// Run the model.
let result = try! model.prediction(from: inputFeatureProvider)

// PUT ANOTHER BREAKPOINT HERE
The code above represents the entire process of compiling, initializing, and running a Core ML model on-device. You should add one breakpoint before the model is compiled and initialized and one one after the prediction is run.
Using Xcode Instruments
Apple does not provide a programmatic way to check where a model is being run. We can, however, use Xcode Instruments tooling to detect ANE usage in function call logs.
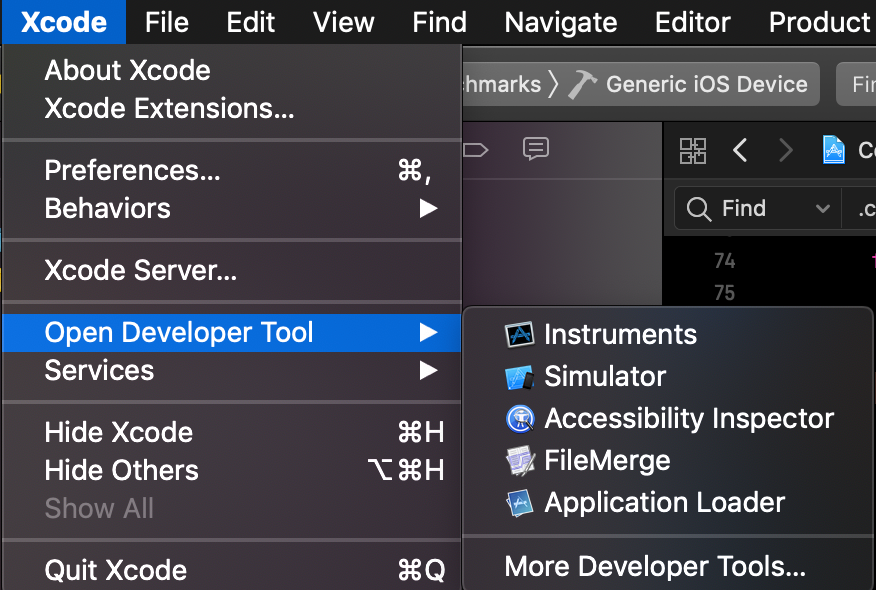
From Xcode, you can open Instruments by selecting Xcode -> Open Developer Tools -> Instruments from the top navbar.
Next, create a new Counters Instrument from the panel.
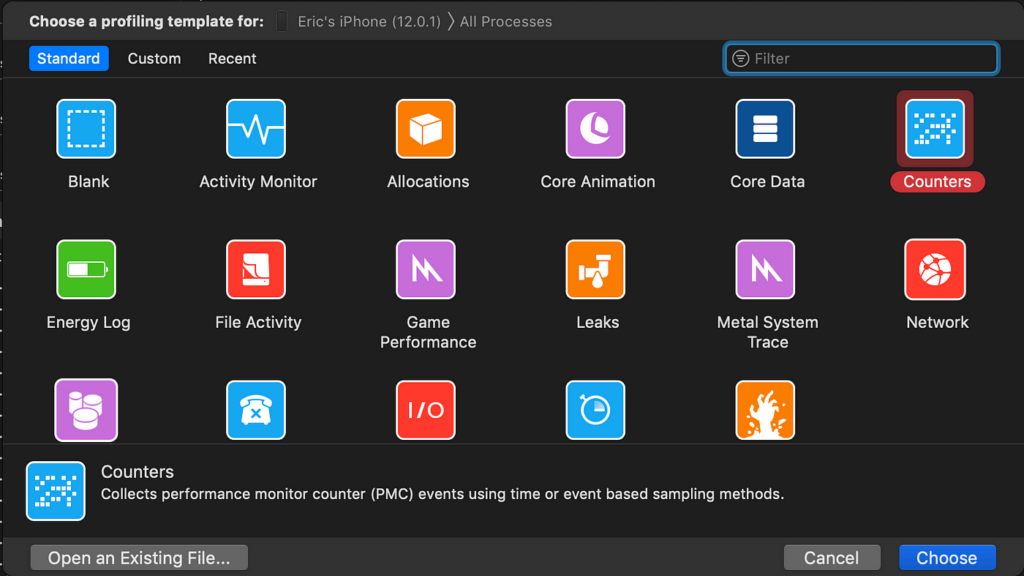
The Counters Instrument keeps track of every method called by our application, and we’ll be able to see where our model is being run based on the method names.
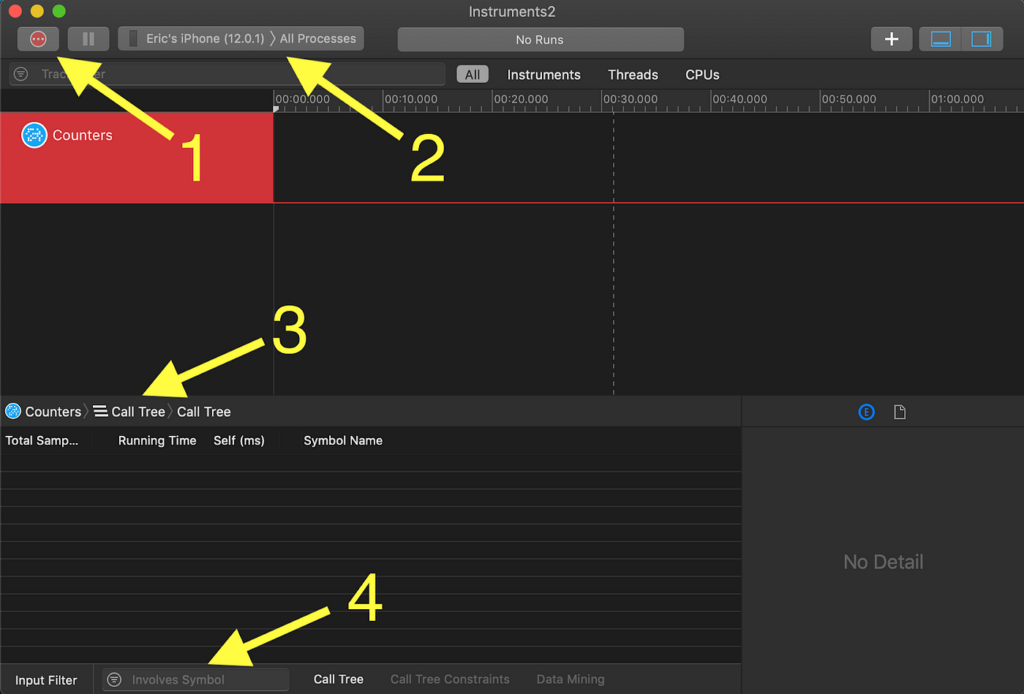
There are four important things to know about the Counters Instrument.
- Record Button: Logs are only gathered while the application is running on the device AND the recording has been turned on. When you’re ready to start recording, just click the red circle. It will turn into a stop button you can use to end the run.
- Device and Process Target: Before starting to record, make sure the physical device is selected. By default All Processes will be monitored. We just want to gather data from our application. After you build and run your application on-device, make sure this value is changed to YOUR APPLICATION NAME (####) where (####) is a process number. Note that if you close and rebuild the application, the process number will change, and you’ll need to select the new process to monitor.
- Sample List: The default mode of Counters counts the number of times a call appears in the call tree. We want to switch this to Sample List by clicking the Call Tree icon.
- Input Filter: Once we have logs, we’ll filter all of the method calls for keywords related to where models are run.
Logging data
We’re finally ready to log data. Back in Xcode, let’s return to the breakpoints. You should have placed them before the model is initialized and after the predict function runs. We’ll use these to make sure we’re only logging function calls related to Core ML.
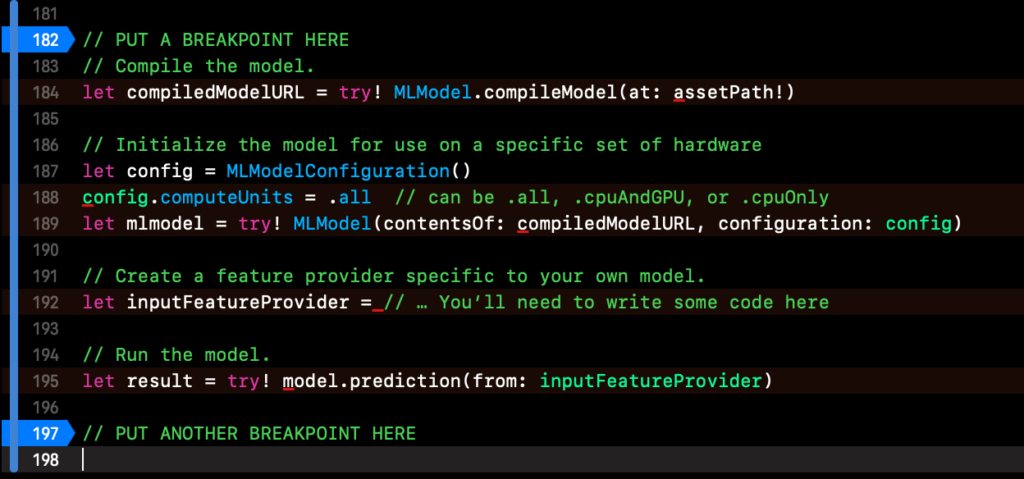
Build and run the application on your test device and perform any actions necessary to trigger the first break point. The next three steps should be performed in relatively quick succession so read ahead:
- Start recording on the Counter Instrument.
- Click the Continue Program Execution button in the debut panel in Xcode and perform any actions needed run your model.
- Once the application hits the next breakpoint, stop recording in the Counter Instrument.
If you’ve done this properly, the Counters Instrument should have recorded data in it.
Identifying Runtime Location
We’ll sift through our logs to determine where the Core ML model was run. First, let’s look at a model that runs on the ANE. This is a simple MobileNet model.
In the Input Filter box found in the lower left corner of the Instruments window, type “ANE” to find calls that make use of Apple Neural Engine APIs.
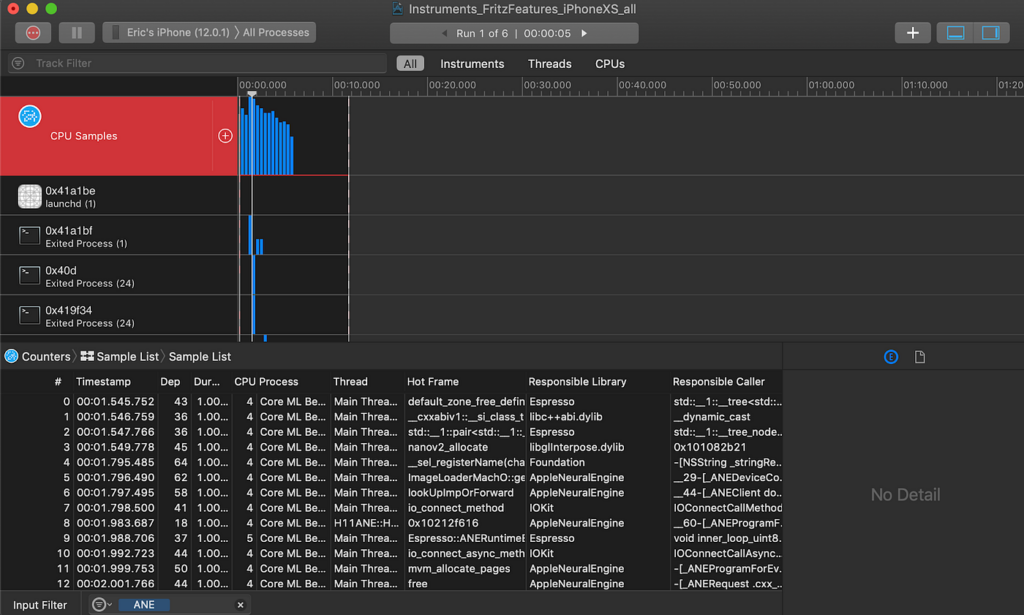
Notice that the Responsible Library is often Apple Neural Engine and the thread name begins with H11ANE. The presence of these calls indicates that our model is making use of the Neural Engine for predictions. If we drill down on a specific call, we can start to make sense of what’s going on.
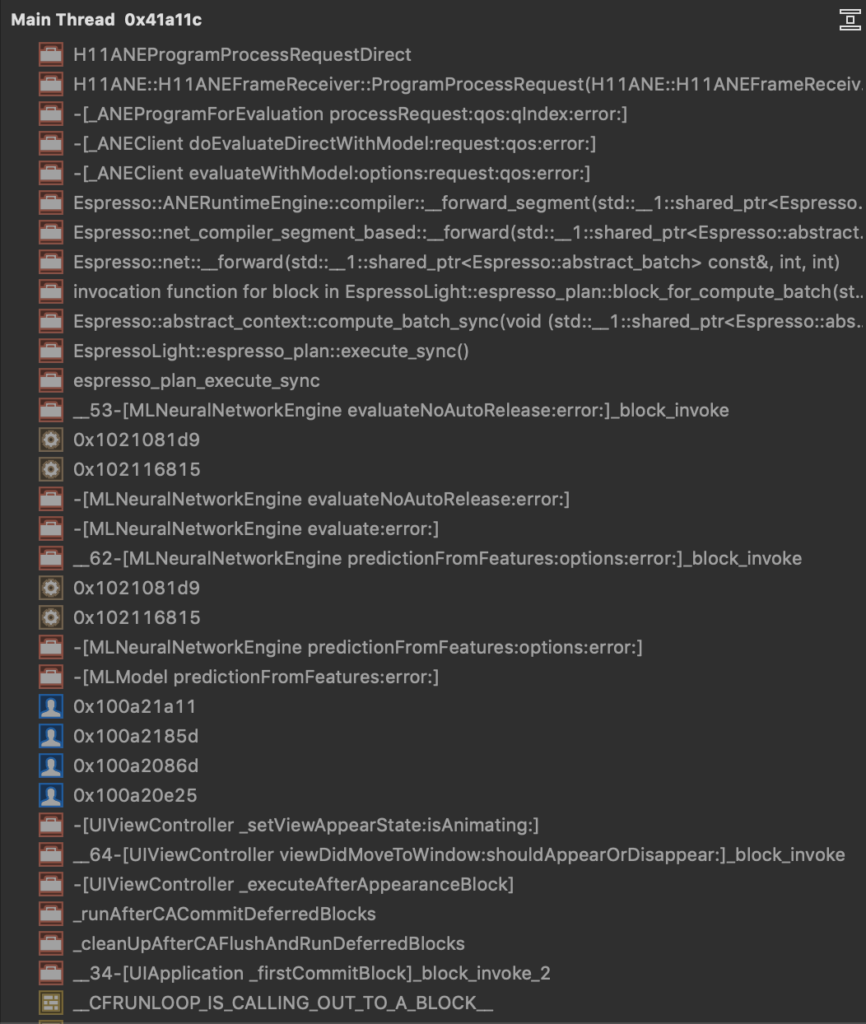
Select a row in the Sample List to see a stack trace. This is a trace for a prediction call. It reads from bottom to top. Midway through, we see a call to MLNeuralNetworkEngine predictionFromFeatures eventually leads to a call to the ANERuntimeEngine.
Now let’s look at a log from a model that doesn’t use the ANE.
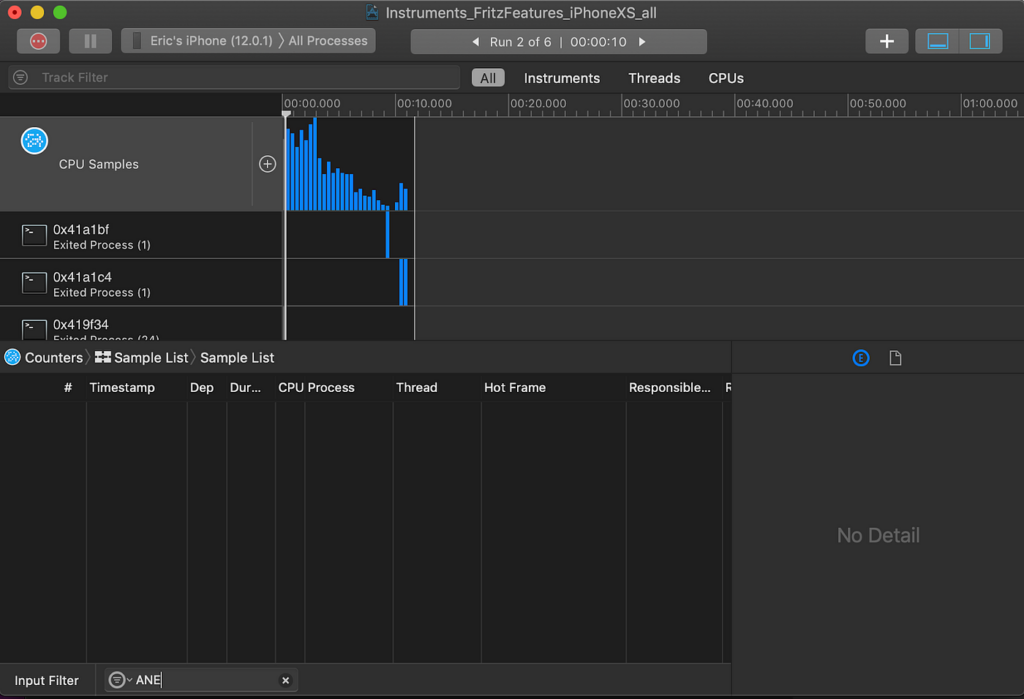
Now calls to any functions containing the phrase ANE appear. However, if we search for the keyword Metal, the name for Apple’s GPU library, we find plenty of hits.
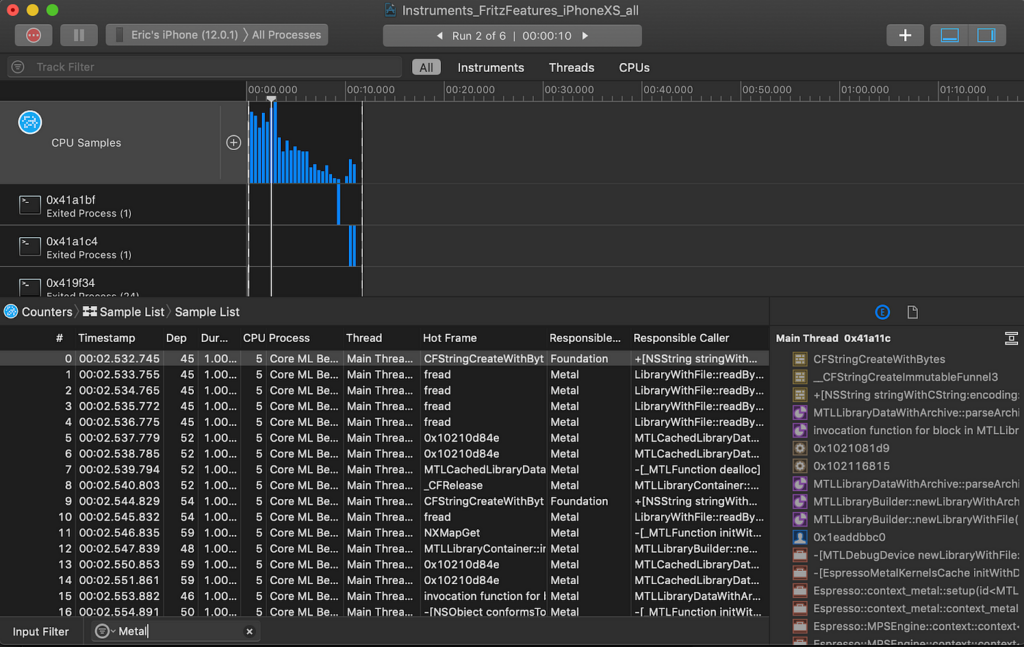
Metal is now the Responsible Library and the MPSEngine (short for Metal Performance Shaders) appears in the stack trace.
To summarize: models that run on the Apple neural engine will have many method calls with the acronym ANE. Models that only run on the GPU will have calls referencing Metal, MTL, or MPS.
Troubleshooting incompatible layers
Now that we have a method for reliably identifying which models run on the ANE, we can start isolating layers that might not be compatible. We do this by creating models with a single layer and testing each individually. Let’s consider two different types of convolution layers: straight forward 2D convolutions and the increasingly popular atrous (or dilated) convolutions.
We can create Core ML models quickly using Keras and coremltools.
# Create a model with a normal convolution.
inpt = keras.layers.Input(shape=(500, 500, 3))
out = keras.layers.Conv2D(10, 10)(inpt)
model = keras.models.Model(inpt, out)
mlmodel = coremltools.converters.keras.convert(model)
mlmodel.save('convolution.mlmodel')

# Create a model with a dialted (atrous) convolution.
inpt = keras.layers.Input(shape=(500, 500, 3))
out = keras.layers.Conv2D(10, 10, dilation_rate=4)(inpt)
model = keras.models.Model(inpt, out)
mlmodel = coremltools.converters.keras.convert(model)
mlmodel.save('convolution_dilation.mlmodel')
Performing the steps in previous sections, we’ll see that standard convolutions run on the ANE, but dilated convolutions will not, despite being supported by Core ML. Armed with this information, we can change our model architecture and retrain without the incompatible layer to improve runtime performance.
Conclusion
Taking advantage of hardware acceleration via Apple’s Neural Engine is extremely important if you want your application to run fast and not drain a user’s battery. This post provides a process to determine if your Core ML model is compatible with the ANE so you can make any necessary changes.

Comments 0 Responses