Living in a “big” city like Casablanca, you tend to forget how the air is polluted — and somehow get used to it.
But don’t get fooled—in addition to emissions from vehicles, the air breathed by citizens in most big cities is contaminated by significant atmospheric emissions from factories and other sources of pollution.
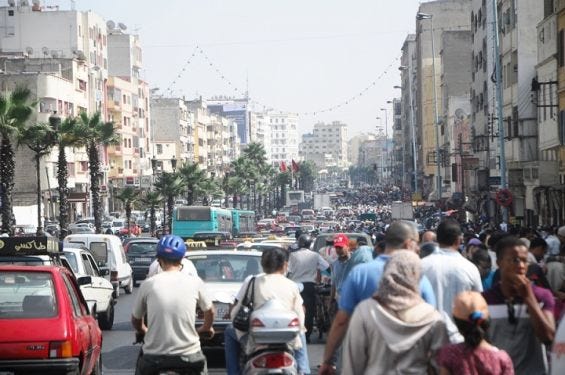
Ambient air pollution, due to high concentrations of small particles (PM10) and fine particles (PM2.5) including pollutants such as sulfate, nitrates, and black carbon, is the main environmental health risk.
It increases the risk of stroke, heart disease, lung cancer, and acute respiratory diseases, including asthma, and causes more than three million premature deaths each year worldwide.
According to experts who compared the levels of fine particles in 795 cities in 67 countries, global levels of urban air pollution increased by 8% between 2008 and 2013.
So what technology can do to tackle this problem — a lot actually, but one way to do it is to monitor or predict the level of pollutants in order to take action, or increase our level of conscience and realize how this might affect our general health.
Machine learning can be part of the solution, but in order to target as many people as possible and give access to this information in a convenient way, it has to be a mobile solution. This is a perfect use case for the combination of ML and mobile development.
In this article, I’ll create a model that can predict the level of small particles on a given day in the city of London and also create a small API that will be consumed by an iOS application.
In this article:
All the material used in this project can be downloaded on my GitHub account:
The data used
For this tutorial, we’re going to use data from London’s Open Data website, which offers multiple kinds of useful and accurate data. In our case, we’re going to use the “Air quality time of the day” file that contains values dating from January 2008 through July 2019.

As outlined above, small particles are particularly dangerous—these particles are said to be “unsedimentable” because they’re unable to settle on the ground under the effect of gravitation (they can therefore travel greater distances under the action of the winds) and are extremely numerous and difficult to quantify, given that they also have a negligible mass. They’re mainly emitted by road traffic, especially diesel cars.
Choosing the right algorithm
This part is probably the most difficult because we have to understand the data in order to pick the right tools.

We want to predict a quantitative value—e.g. 14.12—using only the date as an input, which means it will probably be a regression in which we try to approach a curve. The data is not linear and can’t be approached linearly, and we also know that the data is continuous.
There are a certain number of situations where one seeks to model the values of a variable, classically noted Y, as a function of one or more variables, noted X. The model, carefully defined by equations, can be used either to describe phenomena, often from a causal perspective, or to predict new values, provided certain precautions are taken.
Random Forest
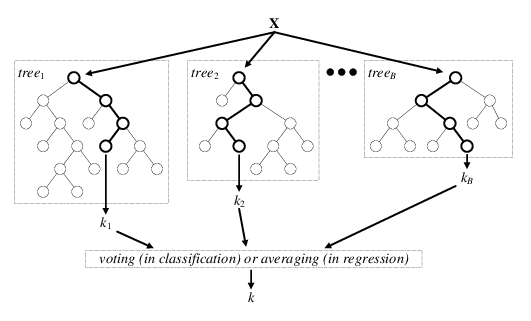
The “random forest” algorithm is a classification algorithm that reduces the variance of forecasts from a single decision tree, thereby improving performance. To do this, it combines many decision trees in a bagging-type approach (bootstrap Aggregation).
In its most classic formula, it performs parallel learning on multiple decision trees randomly constructed and trained on subsets of different data. The ideal number of trees, which can go up to several hundred or more, is an important parameter: it’s highly variable and depends on the problem.
Concretely, each tree in the random forest is trained on a random subset of data according to the principle of bagging, with a random subset of features (variable characteristics of the data) according to the principle of “random projections”.
In the case of classification trees, predictions are then averaged when the data is quantitative or used for a vote when it’s qualitative.
The random forest algorithm is known to be one of the most efficient out-of-the-box classifiers (i.e. requiring little data preprocessing). It’s been used in many applications, such as for the classification of images from the Kinect game console camera in order to identify body positions.
Preprocessing the data
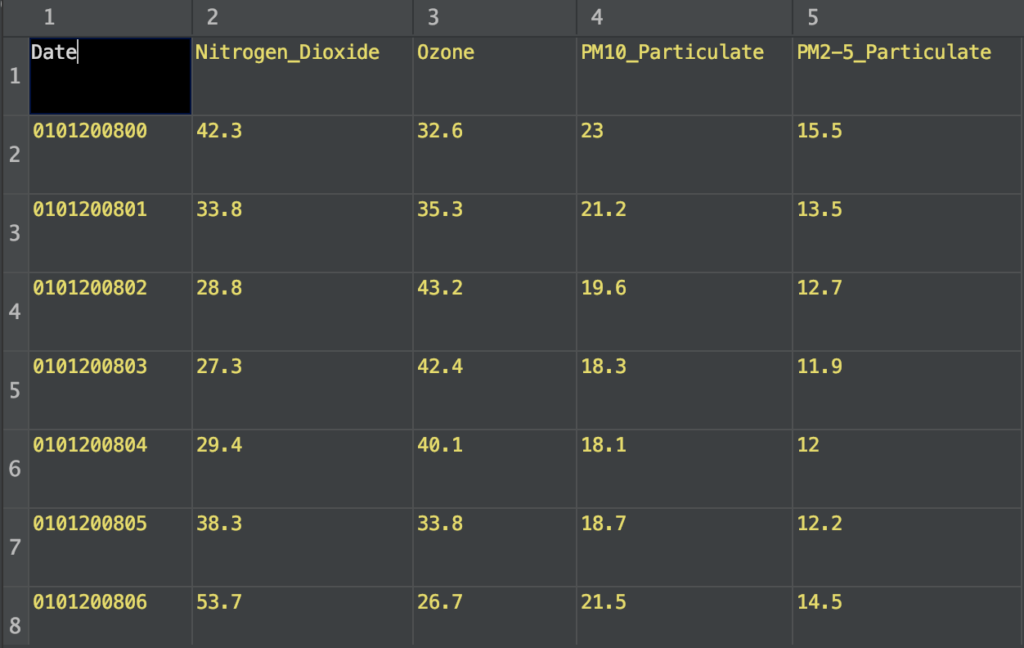
The data provided by “London Datastore” is not yet usable because we need to modify the date format in order to be used as a feature column.
In the original file, the date is formatted as follows:
“Month” — > Jan-08 and “GMT” — > 00:00
I changed that in Excel in order to get something close to this format:
0101200800 which translates to January 01 2008 at 00:00
Even if we’re only going to use the PM2.5 column, I kept the other ones as well in order to use them later in another project. You can also experiment with them as well and try to predict PM10 values, for example.
Train the model
Here are the libraries we need for training:
- pandas: read the .csv file and parse it to a dataframe type.
- sklearn: a huge library with a lot of data science algorithms—we’re only going to use random forest, although you can also use decision tree regression as well.
Here are the steps:
- Read the data from the .csv file using pandas.
- Choose the feature and target column Date and PM2-5_Particulate.
- Split the data into train and test sets— I chose a standard 20/80 split, but you can change it depending on the dataset size you have.
- Instantiate a RandomForestRegressor() variable using sklearn.
- Train the model with the sklearn fit() method that finds the coefficients for the equation specified via the algorithm.
- Export a .pkl file, which is a file created by pickle that enables objects to be serialized to files on disk.
import numpy as np
import pandas as pd
from sklearn.model_selection import train_test_split
from sklearn.externals import joblib
from sklearn.ensemble import RandomForestRegressor
from sklearn import metrics

column_names = ['Date', 'Nitrogen_Dioxide', 'Ozone', 'PM10_Particulate', 'PM2-5_Particulate']

def train():
    data_set = './air-quality-london-time-of-day.csv'

    data = pd.read_csv(data_set, sep=',', names=column_names)
    X = data.iloc[1:, 0].values
    Y = data.iloc[1:, 4].values
    X_train, X_test, Y_train, Y_test = train_test_split(X, Y, test_size=0.2, random_state=0)

    print(type(X_train))

    X_train = X_train.reshape(-1, 1)
    X_test = X_test.reshape(-1, 1)

    regressor = RandomForestRegressor(n_estimators=4000)
    regressor.fit(X_train, Y_train)
    y_pred = regressor.predict(X_test)

    joblib.dump(regressor, 'pollution_prediction.pkl')
    print("Done training")

    print('Mean Absolute Error:', metrics.mean_absolute_error(Y_test, y_pred))
    print('Mean Squared Error:', metrics.mean_squared_error(Y_test, y_pred))
    print('Root Mean Squared Error:', np.sqrt(metrics.mean_squared_error(Y_test, y_pred)))

if __name__ == '__main__':
    train()
The training won’t take long—I calculated that it took me around a minute to perform the training with exactly 4000 decision trees, which is the number of trees in the forest.
You can also tweak the algorithm by changing some parameters (sklearn docs).
Prediction
In the following code snippet, I’ve created a simple function that takes the date as an argument and returns a value.
Here are the steps:
- Load the pickle file that contains our serialized model.
- Make sure that the date is a float.
- Create a NumPy array type from our date so that it can be used to predict the temperature.
- Make the prediction.
- Return the value.
import numpy as np
from sklearn.externals import joblib

def predict_pollution(option):
    tree_model = joblib.load('pollution_prediction.pkl')
    date = [float(option)]
    date = np.asarray(date, dtype=np.float32)
    date = date.reshape(-1, 1)
    print(date)
    temp = tree_model.predict(date)[0]
    print("-" * 48)
    print("nThe pollution is estimated to be: " + str(temp) + "n")
    print("-" * 48)
    return str(temp)
Flask API
Flask is a Python web application micro-framework built on the WSGI library of Werkzeug. Flask can be “micro”, but it’s ready for use in production for a variety of needs.
The “micro” in the micro-frame means that Flask aims to keep the kernel simple but expandable. Flask won’t make many decisions for you, like which database to use, but the decisions made are easy to change. Everything is yours, so Flask can be everything you need and nothing else.
The community also supports a rich ecosystem of extensions to make your application more powerful and easier to develop.
I chose a library called Flask-RESTful made by Twilio that encourages best practices when it comes to APIs.
Here’s the full code (Yeah I know, Flask is great 🙌 !):
from flask import Flask
from flask_restful import Resource, Api
from predict import predict_pollution

app = Flask(__name__)
api = Api(app)

class PollutionPrediction(Resource):
    def get(self, date: str):
        print(date)
        prediction = predict_pollution(date)
        print(prediction)
        return {'prediction': prediction}

api.add_resource(PollutionPrediction, '/<string:date>')

if __name__ == '__main__':
    app.run(debug=True)
Here are the steps:
- Create an instance of Flask.
- Feed the Flask app instance to the Api instance from Flask-RESTful.
- Create a class PollutionPrediction that will be used as an entry point for our API.
- Add a GET method to the class.
- Add the class as a resource to the API and define the routing.
- That’s all 🤩
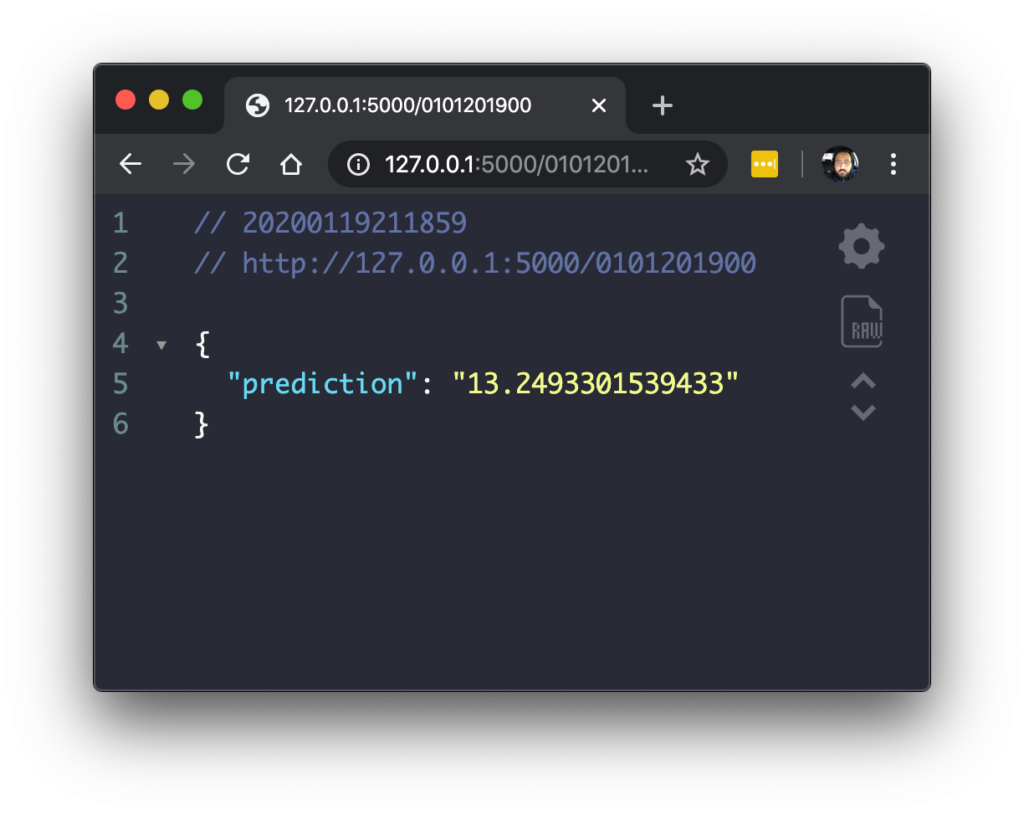
Run the API and use this URL to check:
http://127.0.0.1:5000/0101201900
It should look like this:
Build the iOS Application
Create a new project
To begin, we need to create an iOS project with a single view app. Make sure to choose Storyboard in the “User interface” dropdown menu (Xcode 11 only):
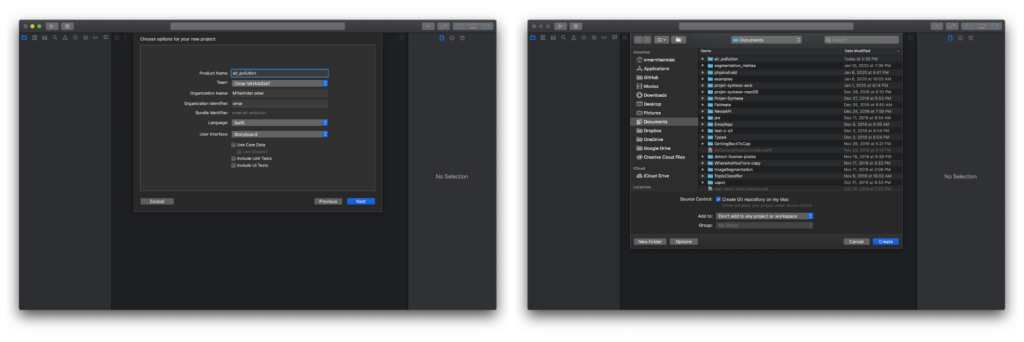
Now we have our project ready to go. I don’t like using storyboards myself, so the app in this tutorial is built programmatically, which means no buttons or switches to toggle — just pure code 🤗.
To follow this method, you’ll have to delete the main.storyboard and set your SceneDelegate.swift file (Xcode 11 only) like so:
func scene(_ scene: UIScene, willConnectTo session: UISceneSession, options connectionOptions: UIScene.ConnectionOptions) {
        // Use this method to optionally configure and attach the UIWindow `window` to the provided UIWindowScene `scene`.
        // If using a storyboard, the `window` property will automatically be initialized and attached to the scene.
        // This delegate does not imply the connecting scene or session are new (see `application:configurationForConnectingSceneSession` instead).
        guard let windowScene = (scene as? UIWindowScene) else { return }

        window = UIWindow(frame: windowScene.coordinateSpace.bounds)
        window?.windowScene = windowScene
        window?.rootViewController = ViewController()
        window?.makeKeyAndVisible()
    }
With Xcode 11, you’ll have to change the Info.plist file like so:
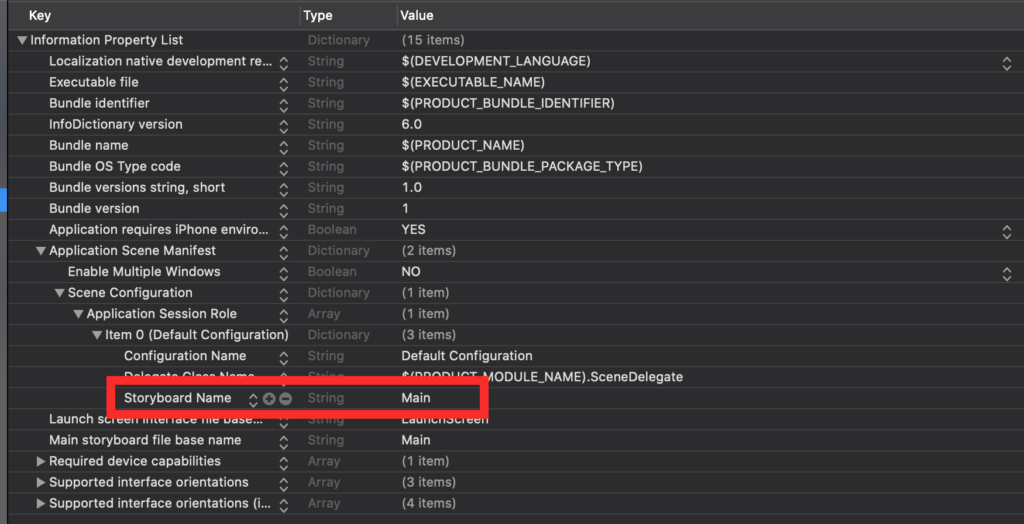
You need to delete the “Storyboard Name” in the file, and that’s about it.
Set up the layout
- Date picker:
- Instantiate a UIDatePicker.
- Set up the layout.
- Add a target to update the prediction every time the user changes the date.
lazy var datePicker = UIDatePicker()

// MARK: - Setup the date picker layout
private func setupPicker() {
    datePicker.translatesAutoresizingMaskIntoConstraints = false
    datePicker.datePickerMode = .date
    datePicker.backgroundColor = #colorLiteral(red: 0.8645390868, green: 0.1406893432, blue: 0.119001396, alpha: 1)
    datePicker.setValue(#colorLiteral(red: 0.000254133367, green: 0.09563607723, blue: 0.6585127711, alpha: 1), forKeyPath: "textColor")
    datePicker.addTarget(self, action: #selector(datePickerChanged(picker:)), for: .valueChanged)

    view.addSubview(datePicker)

    datePicker.centerXAnchor.constraint(equalTo: view.centerXAnchor).isActive = true
    datePicker.bottomAnchor.constraint(equalTo: view.bottomAnchor).isActive = true
    datePicker.heightAnchor.constraint(equalToConstant: view.bounds.height/2).isActive = true
    datePicker.widthAnchor.constraint(equalToConstant: view.bounds.width).isActive = true
}

// MARK: - The picker's target
@objc private func datePickerChanged(picker: UIDatePicker) {
    let dateFormatter = DateFormatter()
    dateFormatter.dateFormat = "yyyy"
    let year: String = dateFormatter.string(from: picker.date)
    dateFormatter.dateFormat = "MM"
    let month: String = dateFormatter.string(from: picker.date)
    dateFormatter.dateFormat = "dd"
    let day: String = dateFormatter.string(from: picker.date)
    let date = "(day)(month)(year)"
    getPrediction(date: date)
}
2. Label
- Instantiate a UILabel.
- Set up the layout and add it to the subview.
lazy var label = UILabel()
lazy var labelType = UILabel()
// MARK: - Setup the label layout and add it to the subview
private func setupLabel() {

    labelType.translatesAutoresizingMaskIntoConstraints = false
    labelType.font = UIFont(name: "Avenir-Heavy", size: 60)
    labelType.textColor = #colorLiteral(red: 0.000254133367, green: 0.09563607723, blue: 0.6585127711, alpha: 1)
    view.addSubview(labelType)
    labelType.text = "PM2.5n --------"
    labelType.centerXAnchor.constraint(equalTo: view.centerXAnchor).isActive = true
    labelType.topAnchor.constraint(equalTo: view.topAnchor, constant: 70).isActive = true
    labelType.numberOfLines = 2

    label.translatesAutoresizingMaskIntoConstraints = false
    label.font = UIFont(name: "Avenir", size: 70)
    label.textColor = #colorLiteral(red: 0.000254133367, green: 0.09563607723, blue: 0.6585127711, alpha: 1)
    view.addSubview(label)
    label.centerXAnchor.constraint(equalTo: view.centerXAnchor).isActive = true
    label.topAnchor.constraint(equalTo: labelType.bottomAnchor, constant: 40).isActive = true
}
API calls
We can make a pretty easy and straightforward call using URLRequest, Apple’s native API that includes the HTTP methods (GET, POST, DEL…) and the HTTP headers.
We need a GET call in order to get the pollution prediction:
 func getPrediction(date: String) {

    var request = URLRequest(url: URL(string: "http://127.0.0.1:5000/(date)23")!)
    request.httpMethod = "GET"
    request.addValue("application/json", forHTTPHeaderField: "Content-Type")

    let session = URLSession.shared
    let task = session.dataTask(with: request, completionHandler: { data, response, error -> Void in
        do {
            let json = try JSONSerialization.jsonObject(with: data!) as! Dictionary<String, AnyObject>
            if let respond = json.values.first {
                DispatchQueue.main.async {
                    let pollution = respond as! String
                    let pollutionFloat = Float(temp)
                    let pollutionString = String(format: "%.2f", pollutionFloat!)
                    self.label.text = "(pollutionString)"
                }
            }
        } catch {
            print("error")
        }
    })

    task.resume()
}
Evaluate the accuracy
Next, we’ll need to test the model on real data and assess its accuracy. The best way to do it is to have a large dataset that you can perform the testing on, and evaluate based on ground truth and the predicted values.
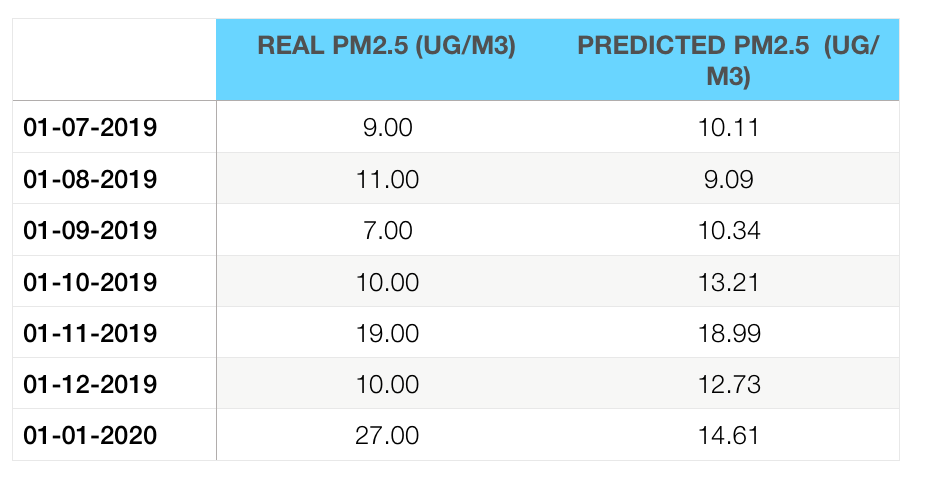
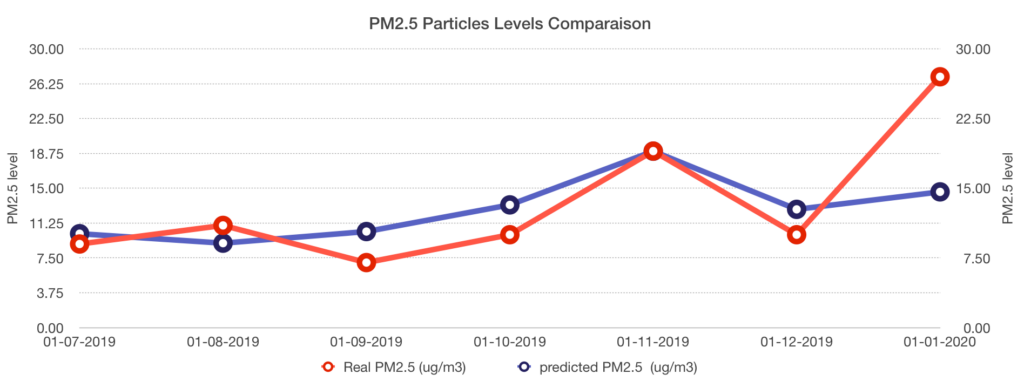
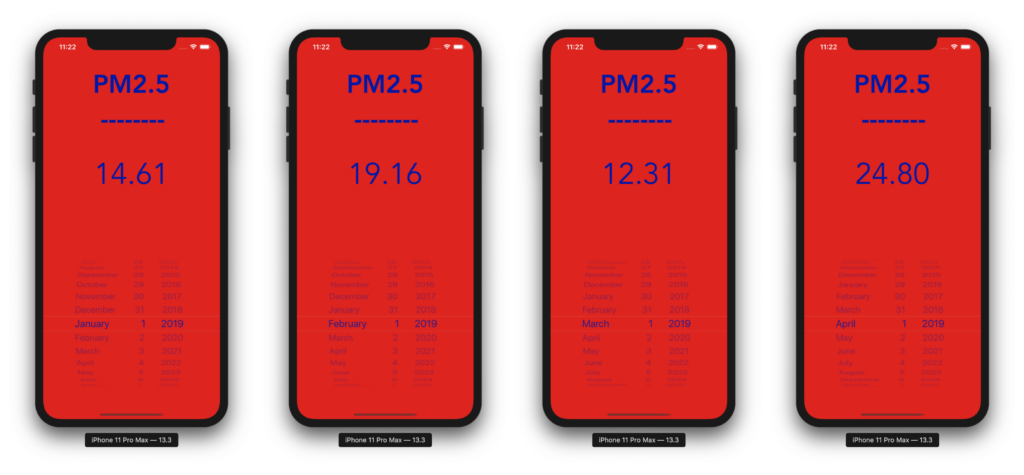
I chose to test the model on 7 months of data, but with a catch—the dataset had a small problem, and we only have the data from the first day of every month. So I will only perform the comparison on the first day of those 7 months.
Predictions are compared with data from the “London Datastore”:
- Real PM2.5 particles
- Predicted PM2.5 particles
Conclusion
Looking at the predicted data, we can clearly see that it’s pretty close to the real data—except for the last one, which I think is an anomaly that could be improved by either increasing the dataset size, or even more interestingly, by reducing it.
Random forests are very sensitive to sudden changes in data trends, and trees may greatly vary upon that. Some would argue that a smaller dataset that’s more homogeneous could improve the prediction.
Finally, the purpose of this prediction is to get an idea of the level of dangerous tiny particles that could be extremely harmful when, say, you go for an outdoor workout. This is especially the case given that we know during times where pollution peaks, intense activities are not recommended— especially for children, the elderly, and those with heart or respiratory diseases.
For the same reasons, it’s still preferable, if you have the possibility, to practice a sports activity as far as possible from the areas where the concentration of fine particles is the highest.
If you liked this tutorial, please share it with your friends. If you have any questions, don’t hesitate to send me an email at [email protected].

Comments 0 Responses